Turn Primavera P6 schedules into Power BI dashboards in minutes
Upload an XER file and instantly generate reporting-ready data, dashboards, and visuals — without the usual Excel cleanup and manual month-end reporting grind.
- Upload XER or MPP files (MPP coming soon)
- Built for project controls workflows
- Track reporting versions by data date
Still rebuilding P6 reports every reporting cycle?
ECS gives project controls teams a faster way to turn schedule files into reporting-ready dashboards, historical comparisons, and stakeholder views — without repetitive spreadsheet prep.
Three Simple Steps
From XER file to Power BI dashboard in minutes
Upload your schedule
Import an XER file to start a new reporting dataset.
Structure and store the data
ECS organises the schedule data into a reporting-ready model and preserves reporting versions by data date.
Review dashboards and trends
Explore dashboards, Gantt views, S-curves, histograms, milestone trends, and other reporting visuals.
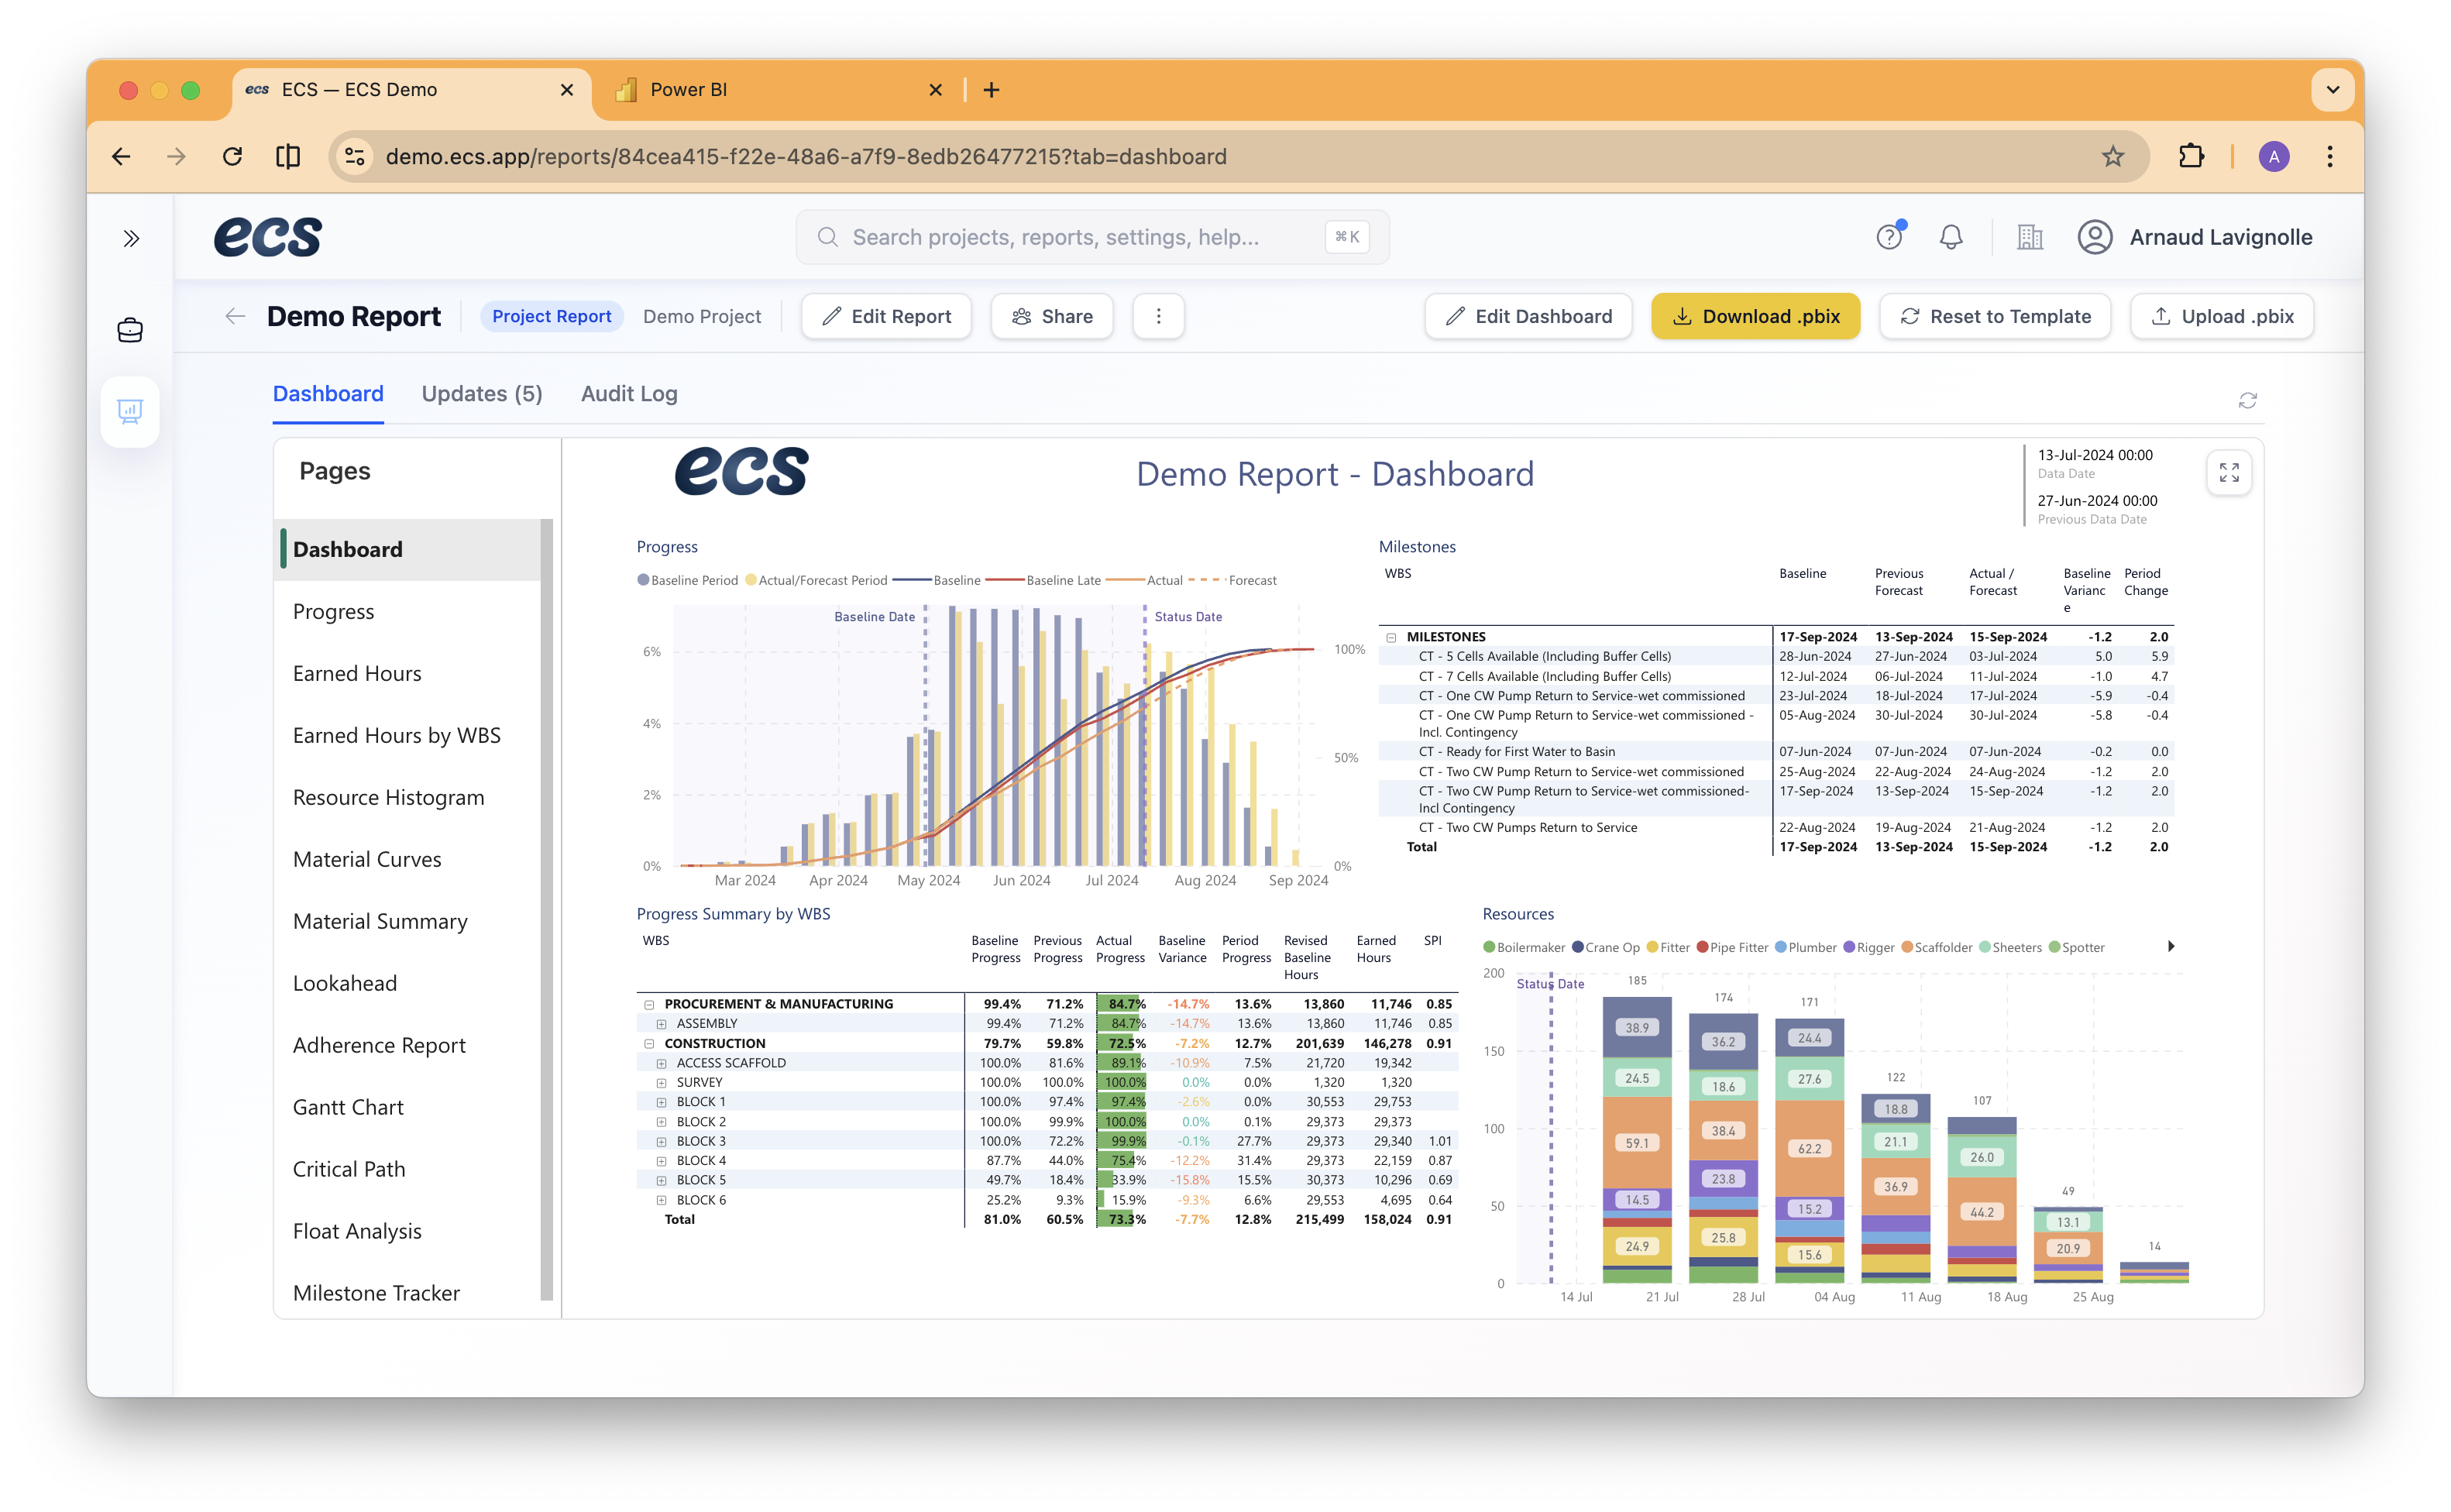
What ECS Does
Upload and version control
Upload XER files, store reporting periods by data date, and preserve historical snapshots.
Reporting and dashboards
Generate a Power BI-ready data model, use prebuilt dashboards, and create reporting outputs for stakeholders.
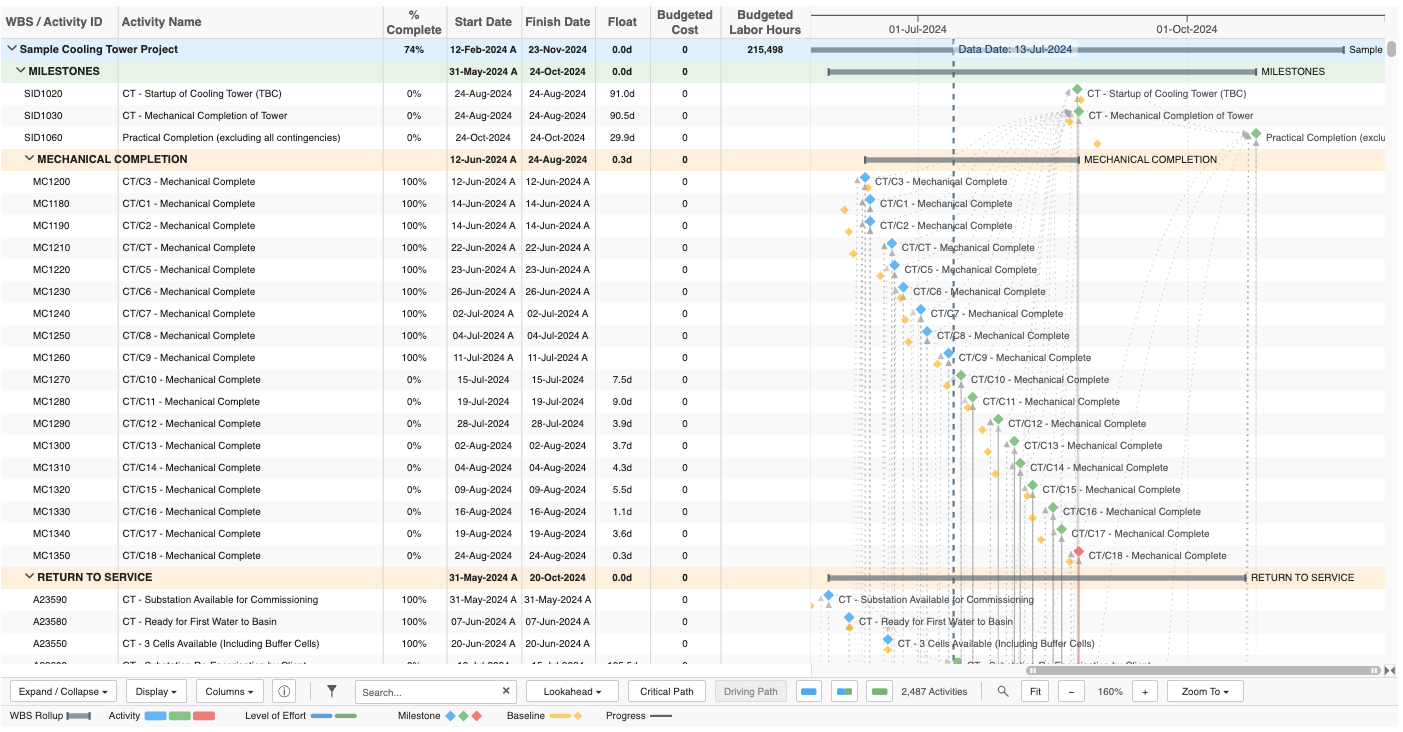
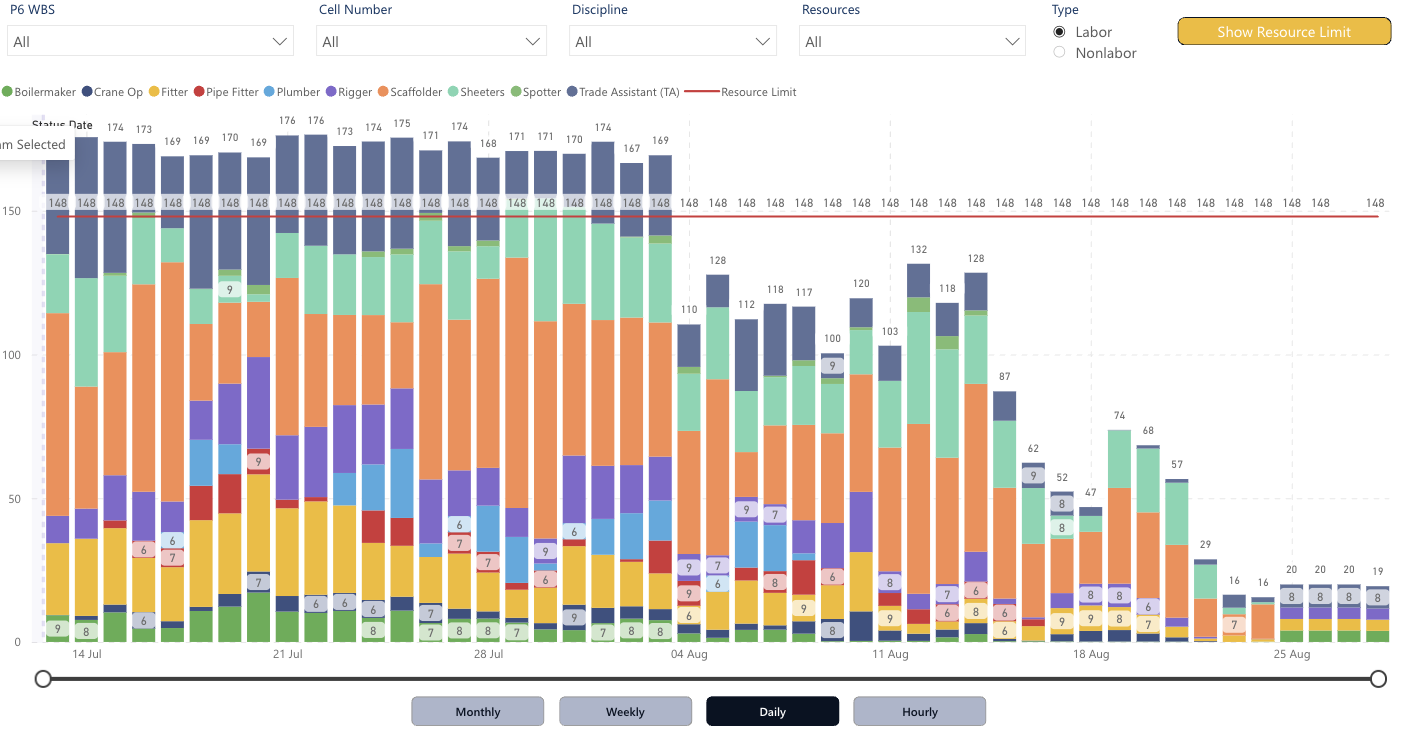
Schedule analysis visuals
Review Gantt views, S-curves, resource histograms, milestone trends, and look-ahead views in one place.
Historical comparison
Compare reporting periods, track schedule movement over time, and maintain a clean reporting archive.
ECS vs Manual Reporting
Automated dashboards vs spreadsheet workflows
See the reporting outputs
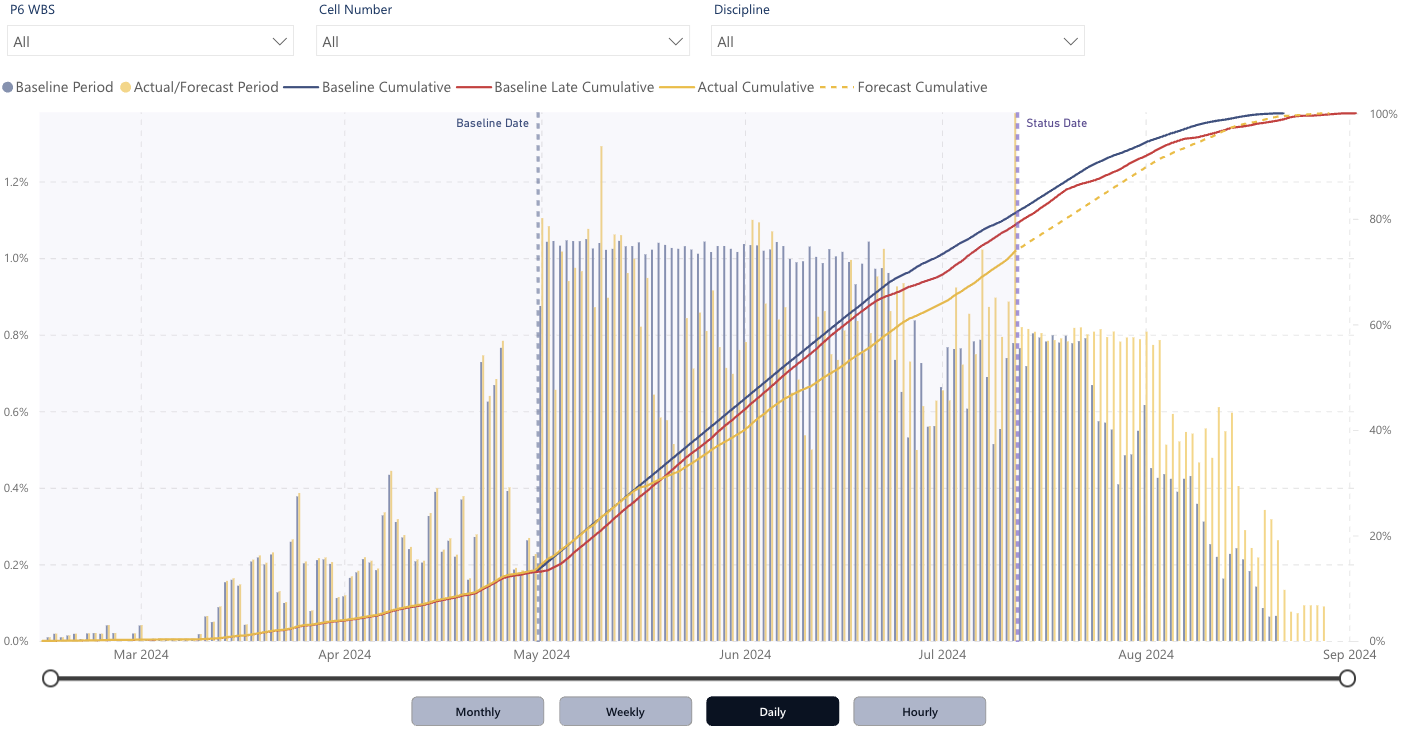
Progress curves and S-curves
Interactive schedule visualisation
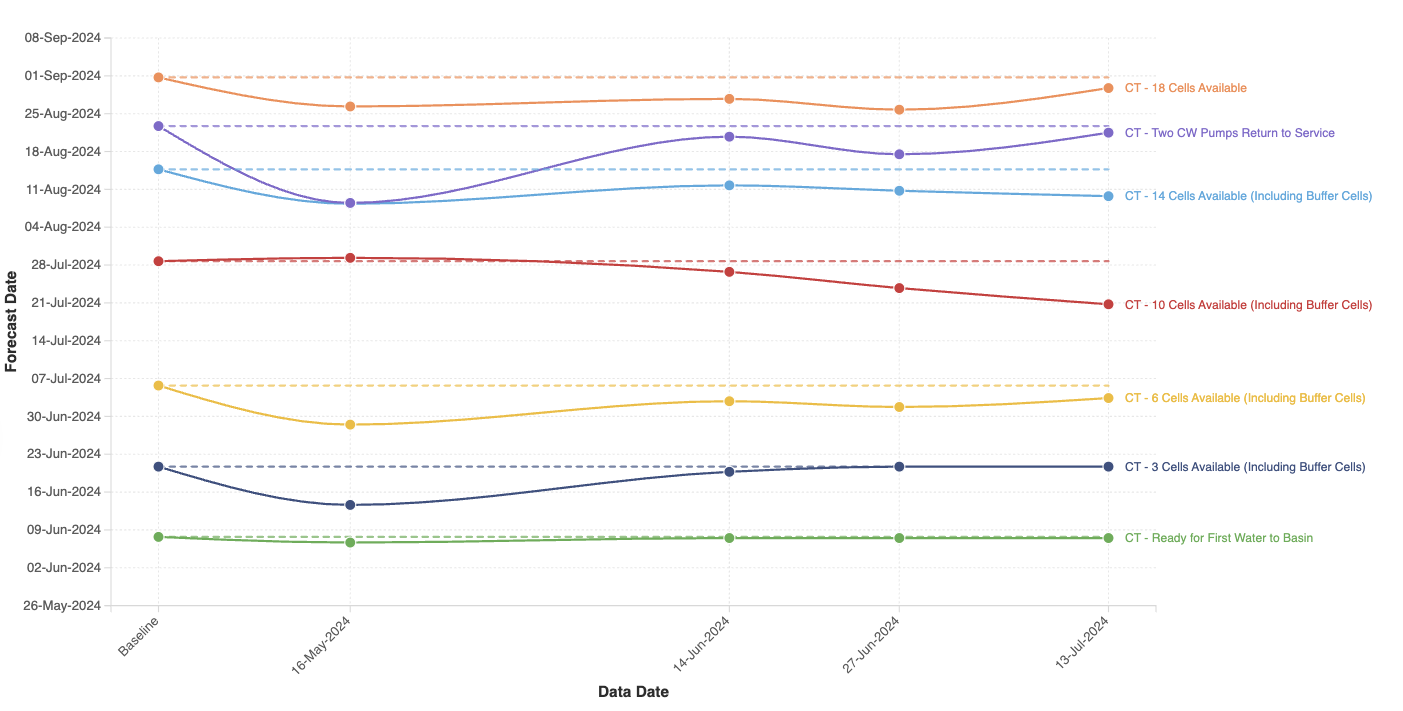
Track trends across reporting periods

Built by a project controls practitioner
Arnaud Lavignolle — Founder, ECS
ECS was built by Arnaud Lavignolle. Alongside ECS, Arnaud is Managing Director of Axiom Project Services, a 70-person project controls consultancy working on mining, oil and gas, energy, and infrastructure projects worldwide. After years of watching teams spend too much time manually preparing Primavera P6 data for reporting, he built ECS to make schedule reporting faster, clearer, and easier to repeat across every reporting cycle.
Start with your next reporting cycle
Upload an XER file and see how quickly ECS turns schedule data into reporting-ready dashboards and visuals.