Project BI — Instant Power BI reporting for Primavera P6
Upload Primavera P6 or Microsoft Project files, and ECS Project BI delivers professional Power BI project dashboards — full-featured Gantt viewer, S-Curves, progress reporting, resource histograms, milestone trending, look-aheads, and more.
Three Simple Steps
From XER file to Power BI dashboard in minutes
Upload Your XER
Drag and drop your Primavera P6 XER file or Microsoft Project file. We handle the rest.
Automatic Processing
ECS parses your schedule, calculates timephased data, and stores everything securely.
View in Power BI
Connect Power BI to your ECS data and start using our pre-built dashboards and custom visuals.
Everything You Need for P6 Reporting
Built by project controls engineers, for project controls engineers
Lightning Fast Processing
Upload your XER file and get results in seconds. Our optimized parsing engine handles even the largest P6 schedules with thousands of activities.
- Handles schedules with 50,000+ activities
- Automatic validation and error detection
- Progress tracking during upload
- Your data encrypted at rest and in transit
Power BI Integration
Connect your ECS data directly to Microsoft Power BI with our template dashboards. Get professional reports without touching Excel.
- Pre-built dashboard templates
- 15+ Power BI visuals included
- Custom tooltips and drill-through capability
- Direct API connection (no file exports)
Version Control
Full version history for your P6 schedules. Each upload stores progress by data date, enabling accurate period-over-period reporting.
- Progress stored by data date
- Accurate period reporting
- Flexible baseline assignment
- Never lose historical data
Enterprise Security
Enterprise-grade security with multi-tenant isolation and SSO. Your data is encrypted at rest and in transit, with 99.9% uptime target.
- Single sign-on (Microsoft, Google, SAML)
- Multi-tenant data isolation
- 99.9% uptime target
- No software to install
Power BI Gantt Chart
A modern, full-featured Gantt chart visual built by and exclusive to ECS. View your entire schedule with WBS hierarchy, critical path, baseline comparison, realtionships, resource assignments, and more.
- Full WBS hierarchy with expand/collapse
- Critical path highlighting
- Baseline bars for variance analysis
- Custom Power BI visual included
Fully Customizable
Use Power BI's full capabilities to create any visualization you need. Build custom reports tailored to your stakeholders.
- Custom DAX measures and calculations
- Flexible filtering and slicing
- Drill-down and drill-through capability
- Export to PowerPoint and PDF
ECS vs Manual Reporting
Automated dashboards vs spreadsheet workflows
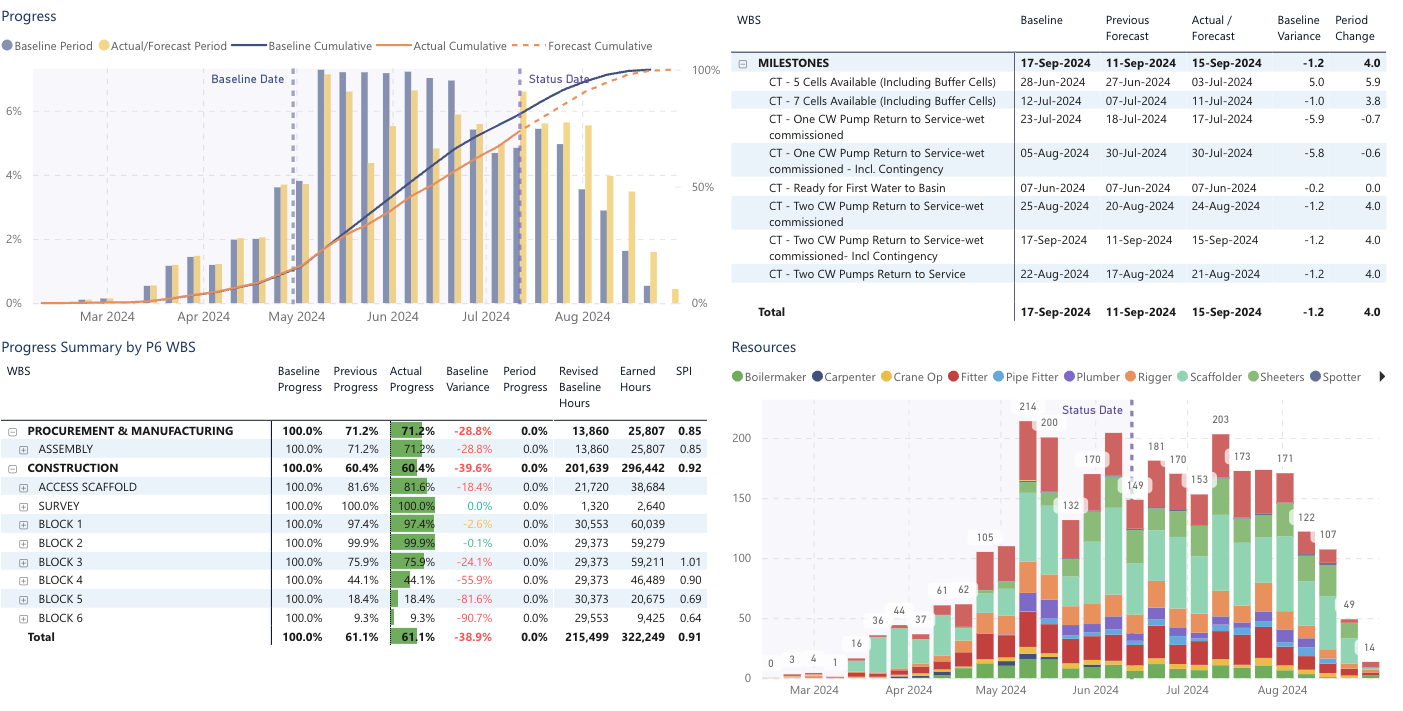
Professional Power BI visuals, ready to use
Customisable, interactive charts and reports designed specifically for project controls, including:
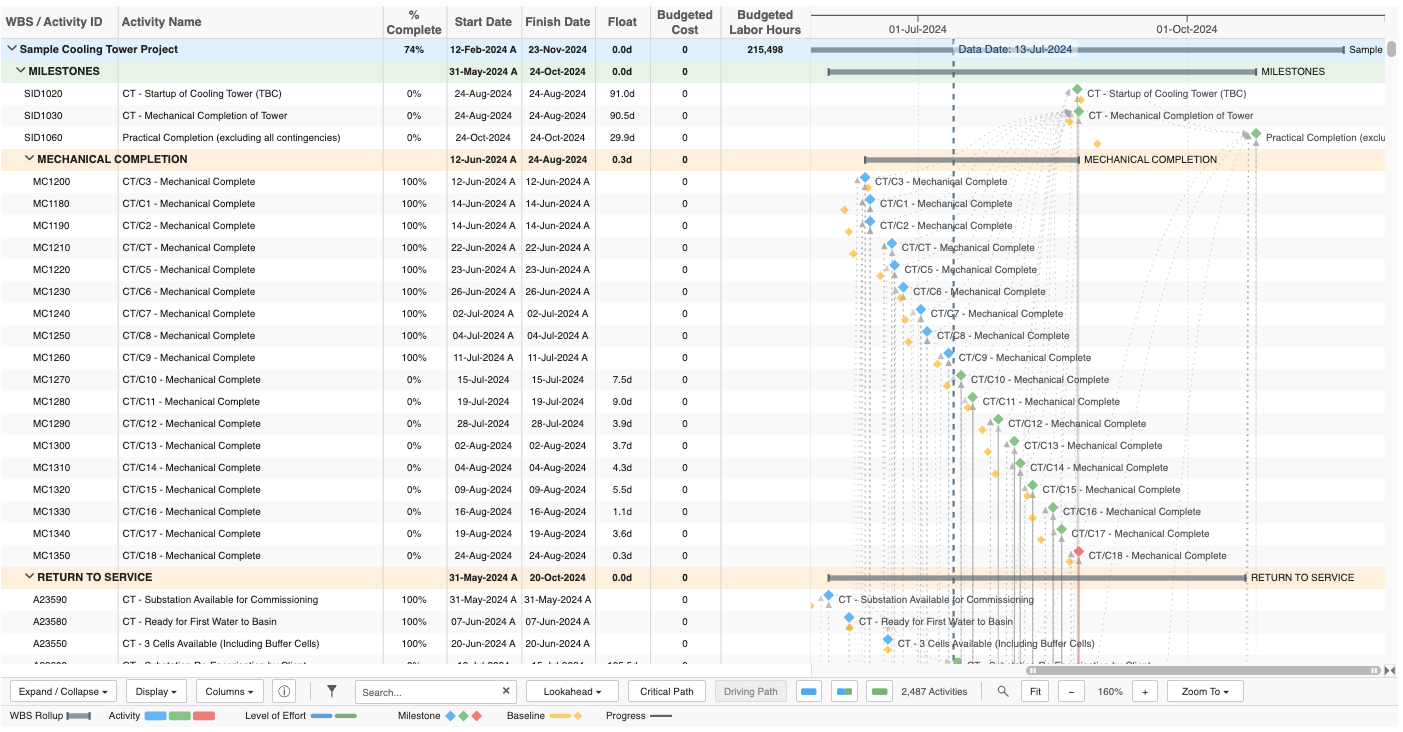
Power BI Gantt Chart
Modern schedule visualization
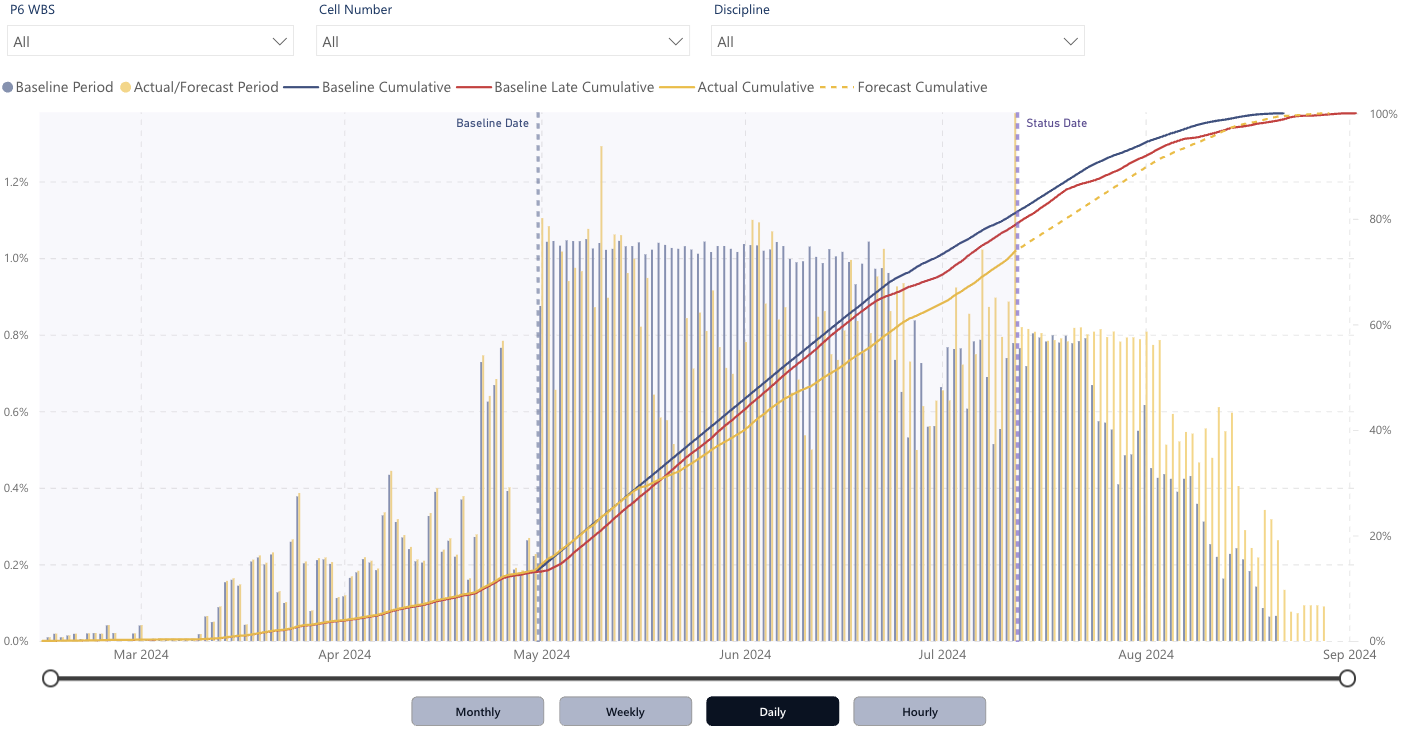
Progress S-Curve
Planned vs actual progress
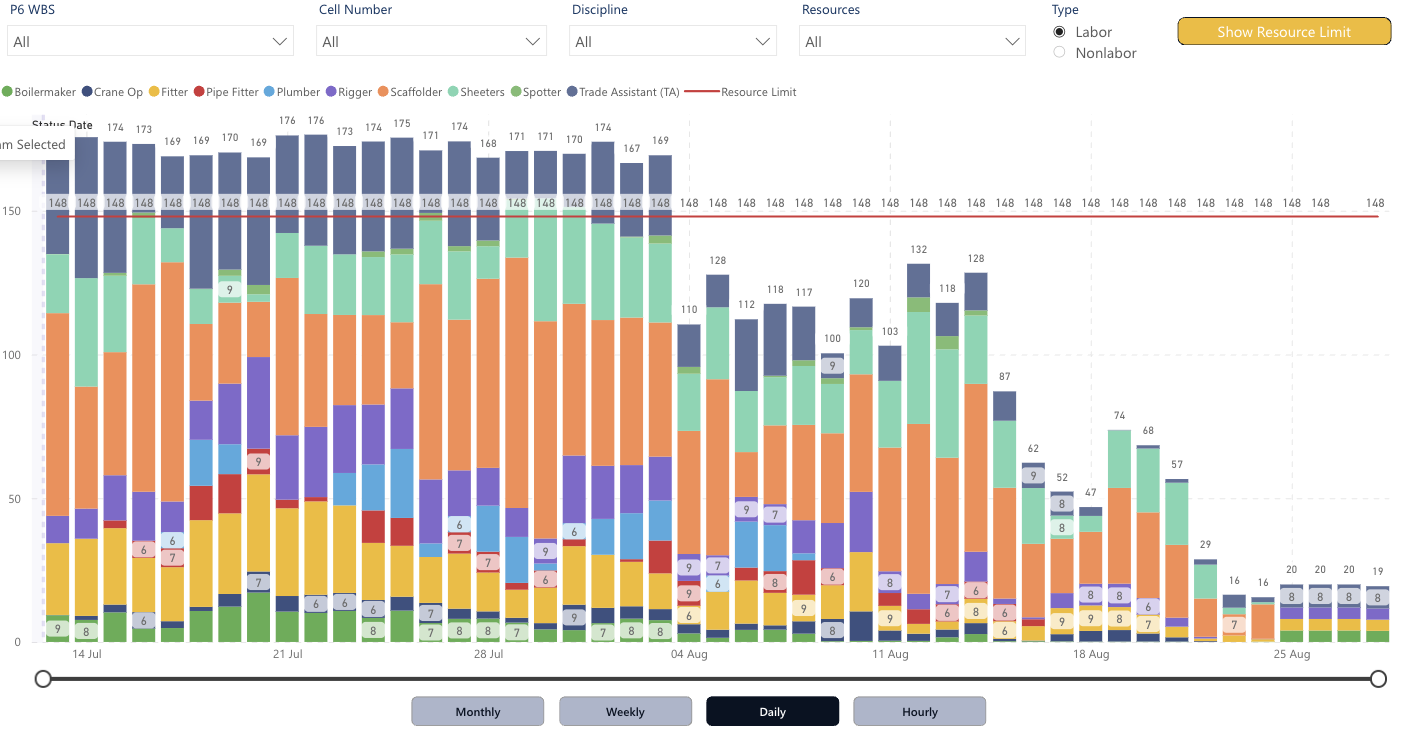
Resource Histogram
Calendar-aware timephasing
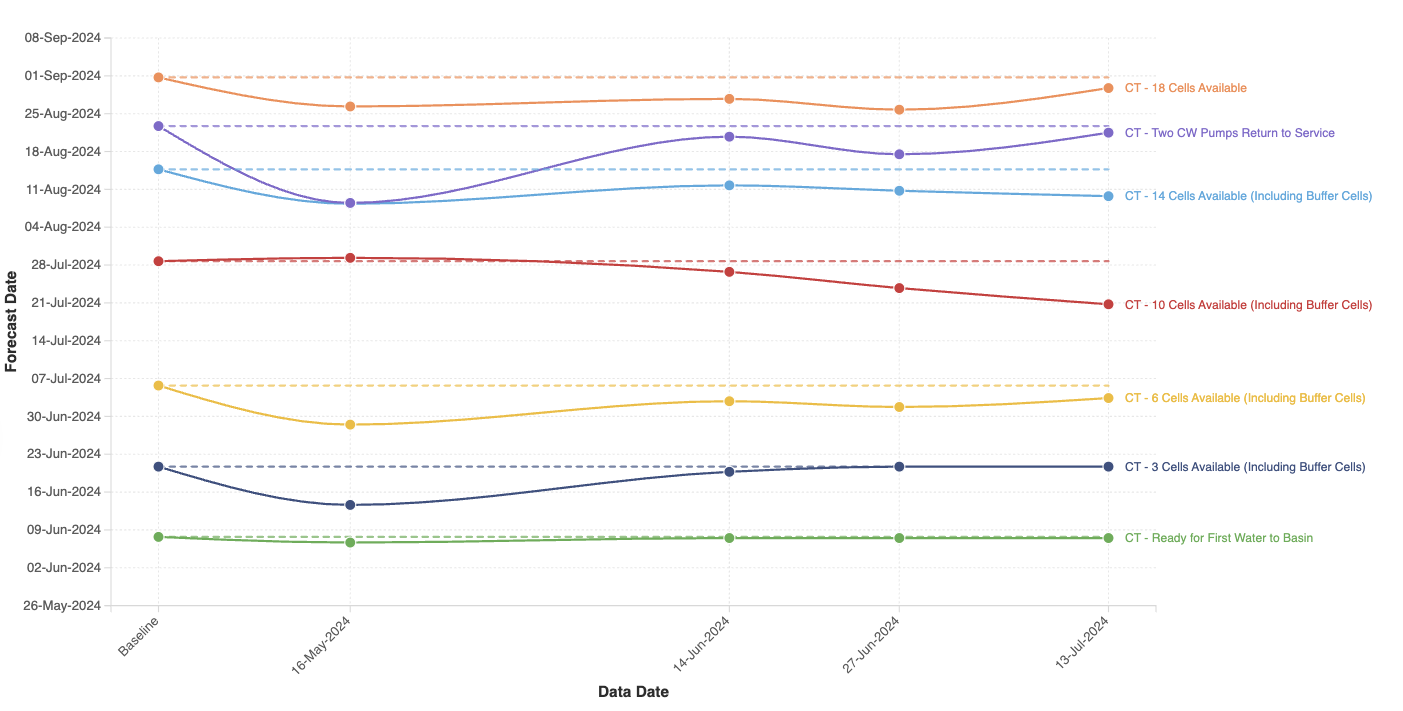
Milestone Variance
Track forecast changes
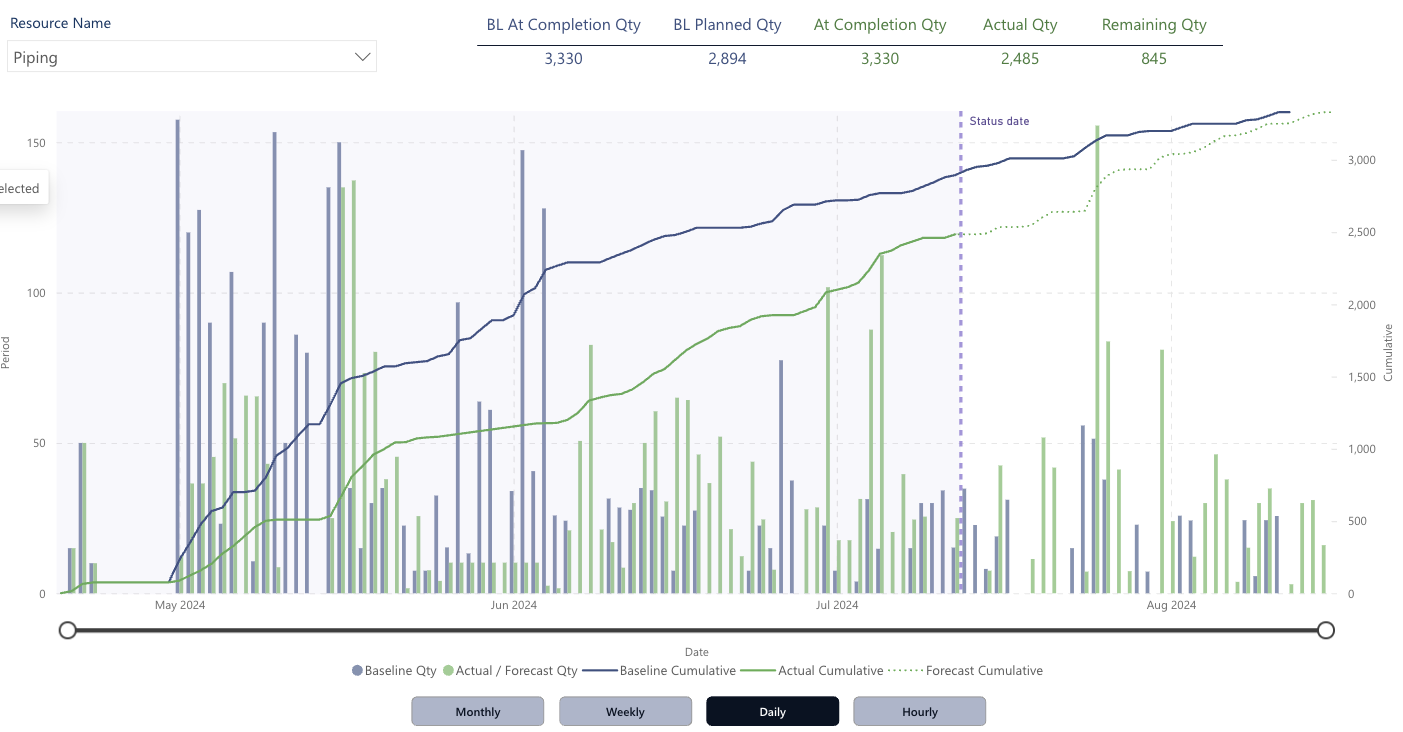
Material Curves
Track material quantities over time
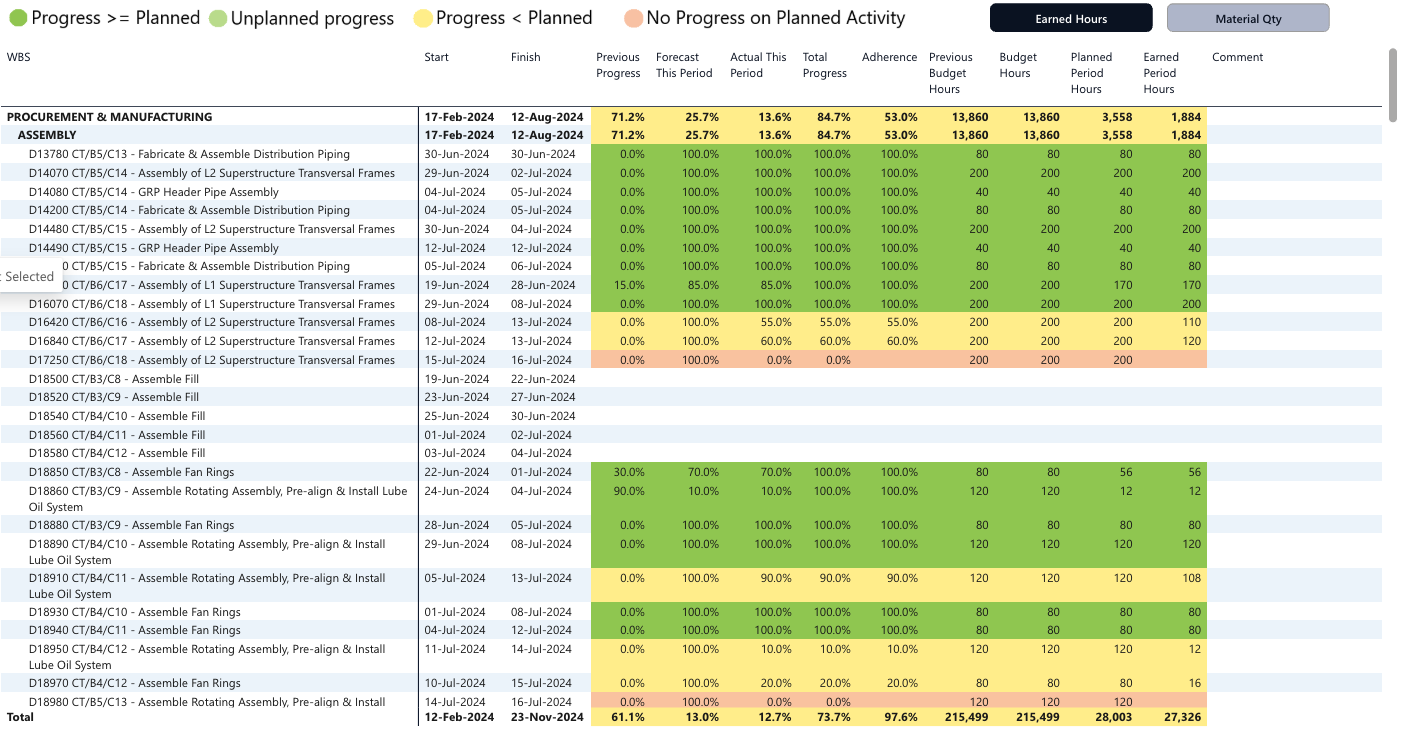
Schedule Adherence Report
Measure schedule performance
Trusted by project controls teams in
Built by Project Controls Engineers
Arnaud Lavignolle
Founder & Director — Engineering and Construction Systems Pty Ltd
With 20 years of experience in project controls across mining, energy, oil & gas, and infrastructure, Arnaud founded ECS to solve a problem he saw every day: teams spending hours manually processing P6 data into Excel reports instead of actually managing their projects.
ECS combines deep domain expertise in Primavera P6 with modern cloud technology and Power BI to deliver instant, professional project reporting — so project controls engineers can focus on what matters.
Ready to Transform Your P6 Reporting?
Start saving hours on every reporting cycle